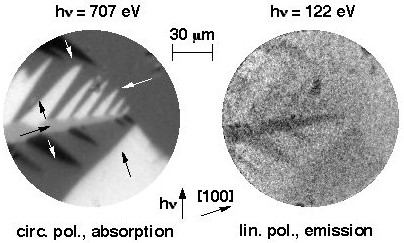
Both images show
the magnetic domains at the identical position of an Fe(001) whisker surface.
The left image is taken using the "standard" XMCD
contrast at the Fe L3 absorption edge. No electron energy filtering is applied
in that case. Arrows in some domains indicate the local magnetization directions.
In the right image, the effect of linear magnetic dichroism
in the angular distribution (LMDAD) of photoelectrons has been used to obtain
magnetic contrast. Here the electrons have been energy-filtered to
accept only photoelectrons emitted from the Fe 3p level. Energy-filtering was performed using a retarding
grid imaging energy filter.
Note the complementary
information obtained by the two methods: while the contrast in the left
image is proportional to the projection of the magnetization direction on
the vertical, it is the projection onto the horizontal direction that leads
to the contrast in the right image, although in both cases the light incidence
was from bottom to top, 30° from the sample surface. The reduced statistics
in the right image is a consequence of the much lower intensity due to electron
energy filtering.