Extended
X-ray Absorption Fine Structure (EXAFS)
(H. Wende, C.
Sorg, K. Baberschke)
In the second example [Ref. 232] we deal with the vibrational fine structure in the N 1s pi* resonance of the N2 molecule physisorbed on the Cu(100) surface. In Fig. 2(a) we plot the vibrationally resolved photoabsorption spectrum in the N 1s pi* resonance region of 0.15 ML N2 physisorbed at T=25 K on theCu(100) surface (dots) and gas-phase spectrum calculated using the vibrational constants, FWHM, relative intensities for each vibrational peak (by C.T.Chen et al., Phys. Rev. A40, 6737 (1989)) and assuming a Gauss broadening (spectral resolution) as in our measurements (solid line). The inset shows the discrepancy in the peak position for higher vibrational levels. Fig.2(b) depicts the fitted spectrum. The dots and the solid line represent the data and the fit, respectively. The dashed curves are the individual Voigt peaks. Our results for the low N2 coverage show that noangular dependence in the spectroscopic parameters are present indicating, consequently, an isotropic interaction of the pig orbitals with the substrate. On the other hand, for the multilayer absorption there is a preferential orientation.
In a third example [Refs. 225, 240] we study the shape resonances of
oriented molecules by ab initio theory and NEXAFS experiment at the C K-edge
of hydrocarbon molecules. We demonstrate that the sigma-shape resonance originates
from the multiple scattering of the photoelectron within the molecule. The
angular dependence of the electric dipole transition in the calculations,
as well as the angular dependent experiments for the oriented molecules
give a good opportunity to compare both. The resonance can be assigned
to a sigma* shape resonance. The multiple scattering formalism and the
experiment agree well and thereby support the existence of such features
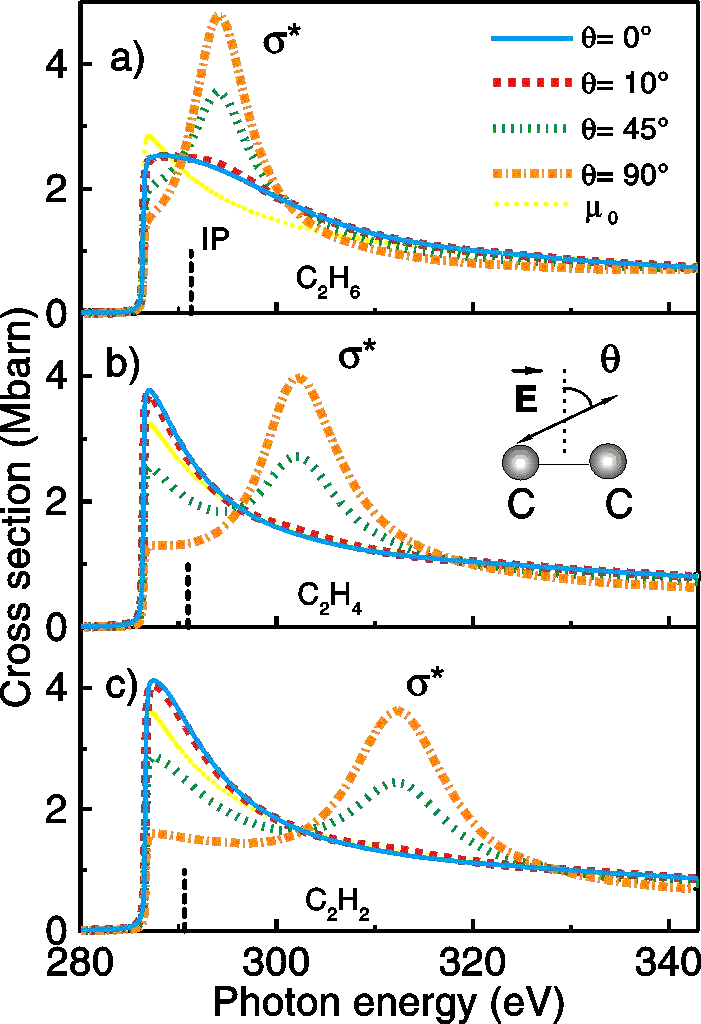
in the spectra. The results of the calculated C 1s NEXAFS spectra for different
orientations of the E-vector of the bottom beam with respect to the intramolecular
C-C bond axis that illustrate the above ideas are presented in Fig. 3. The
vertical lines represent the calculated IP values. The atomic background
µ0(E) is indicated by the yellow dotted line. For all three
hydrocarbons a broad feature in the continuum regime is visible, which
shows an asymmetry with a tail on the high energy side in full agreement
with general considerations in textbook scattering theory. The angular dependence
of this structure is in correspondence to predictions for the angular dependence
of sigma* shape resonance.
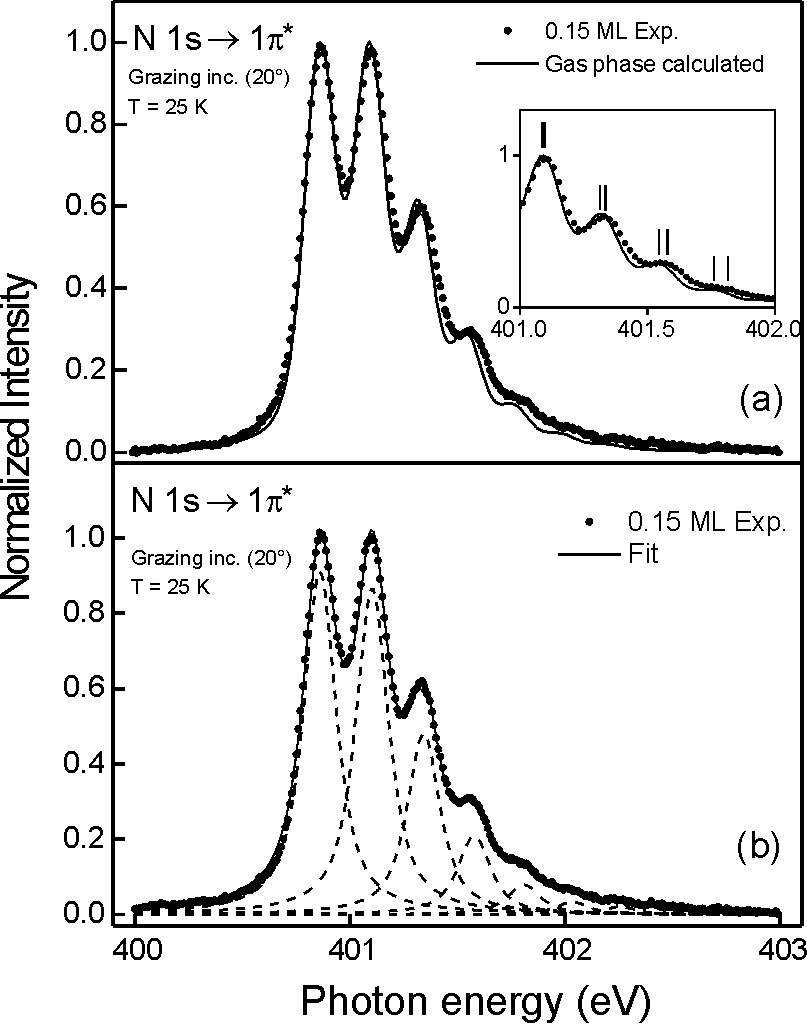
Fig. 2 | Fig.
3 |
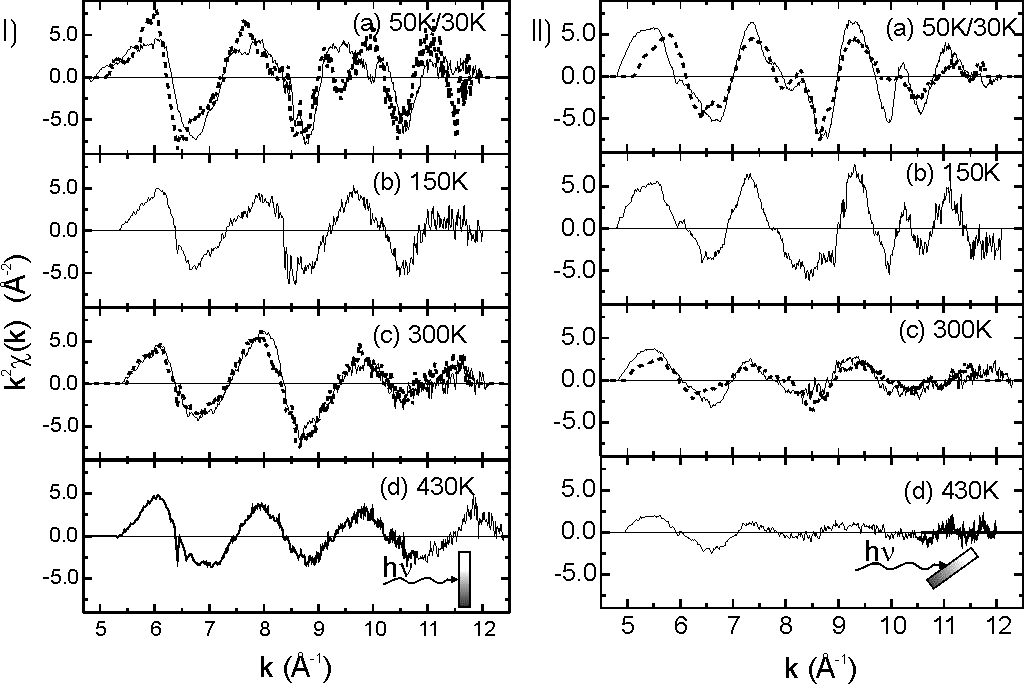
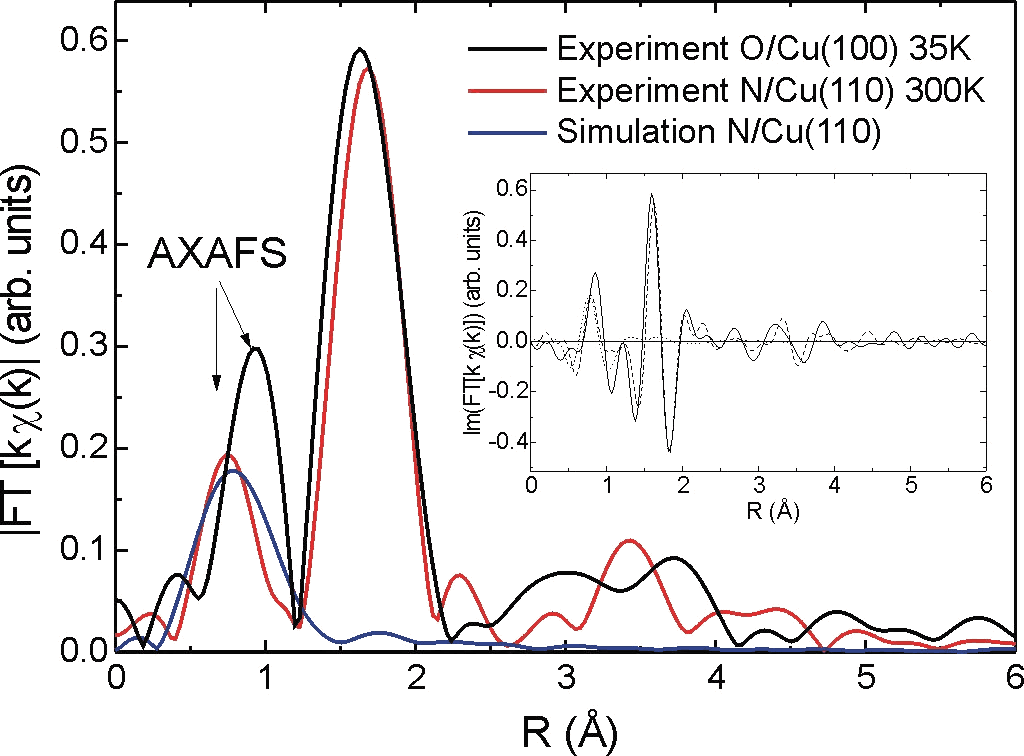
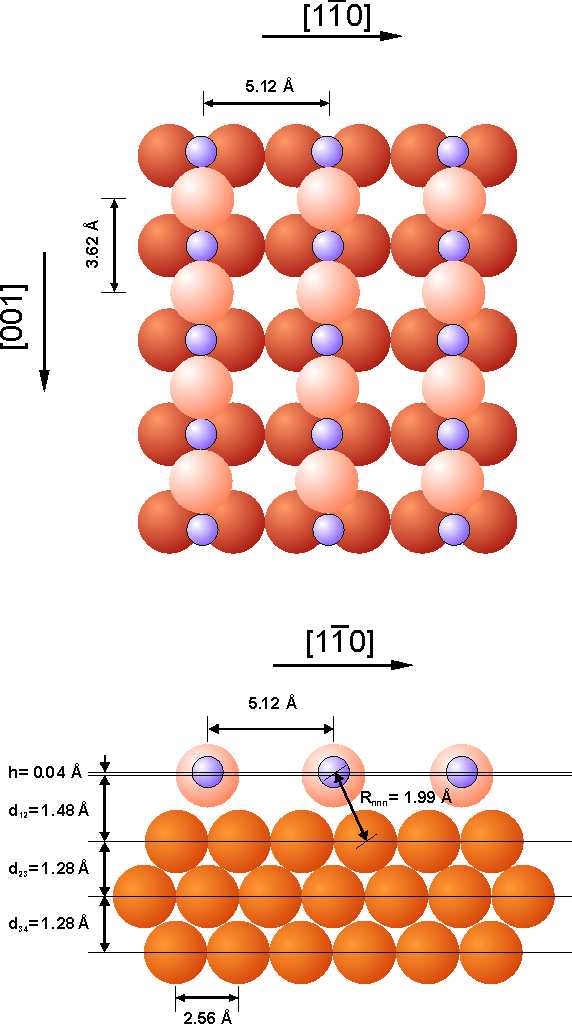
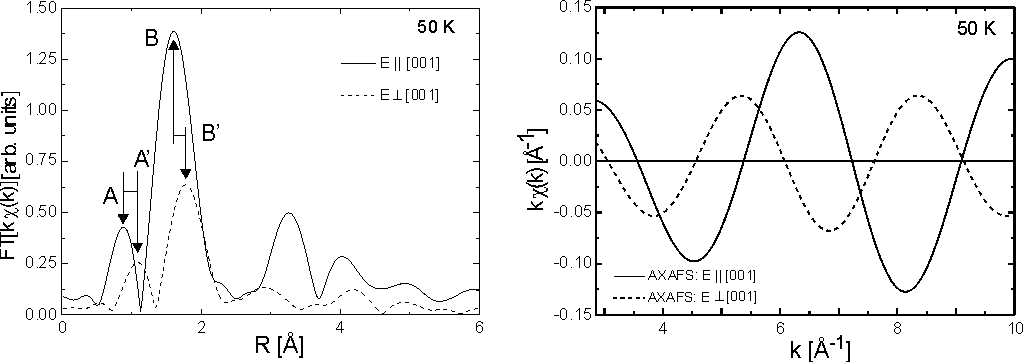
A systematic analysis of the embedded atom EXAFS (AXAFS) effect is presented in Figs.5 and 6. This effect is explained by the backscattering of the photoelectron at interstitial charge densities. The reconstructed (2x1)O/Cu(110) system is an ideal prototype system in which to study the angular dependence of the AXAFS because oxygen-copper rows are formed resulting in a C2 symmetry. The scattering potential is non-spherical because of the high directionality of the O-Cu bonds. The high signal-to-noise ratio of the experimental data enables us to clearly identify the AXAFS contribution. Here we present the definite angular dependence of the experimental AXAFS for the first time [Ref. 279], giving a unique opportunity to measure the anisotropy of the local embedded atom potential. The angular dependence demonstrates that the AXAFS effect cannot be mimicked by multi-electron excitations or experimental artefacts for this system. We compare our experiments to theoretical calculations within the muffin-.tin approximation and show that future full-potential calculations are needed to model the angular dependence determined.
Fig. 5
Fig. 6
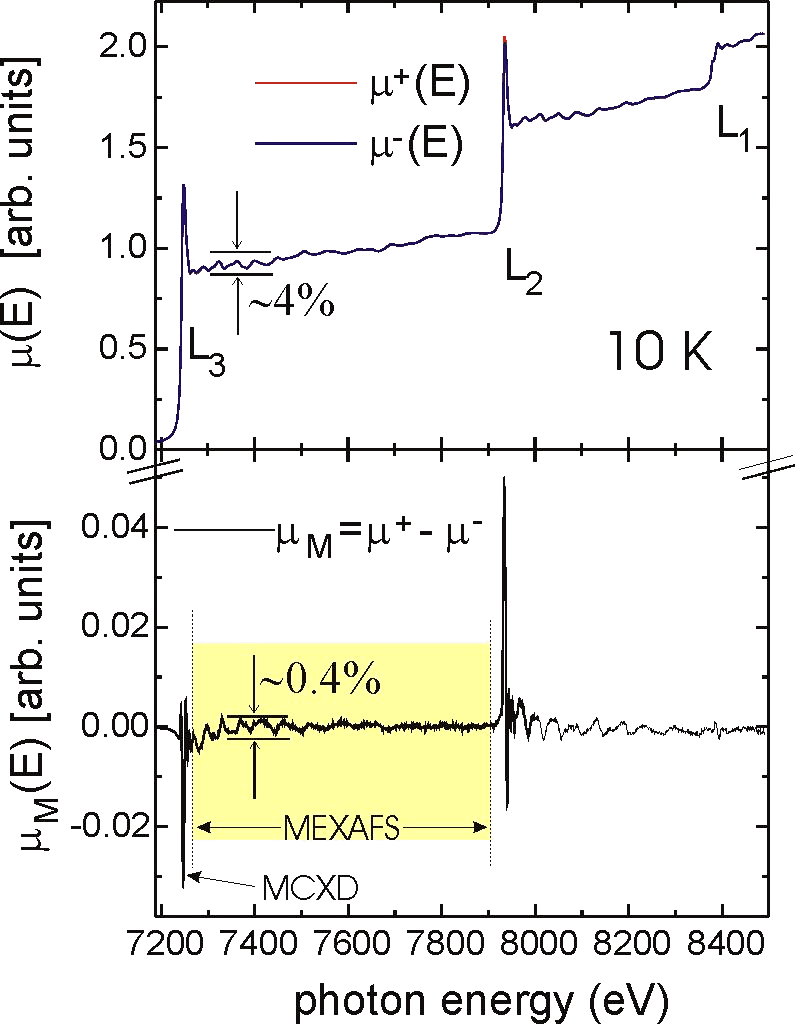
In Fig. 7 one may see the x-ray absorption coefficient at the Gd L3
, L2 and L1 edges for right µ +(E)
and left µ-(E) circularly polarized x-rays (top) at
T=10 K. The magnetic signal is calculated from the difference µ
M(E) = µ+(E) - µ-(E) (bottom).
The data were recorded at the ID12A beamline at the E.S.R.F. using the
gap scan technique. As seen in Fig. 7 the EXAFS oscillations are of about
4% of the edge jump, while MEXAFS is about a factor of 10 less. This shows
that the data have to be recorded with an excellent signal-to-noise ratio.
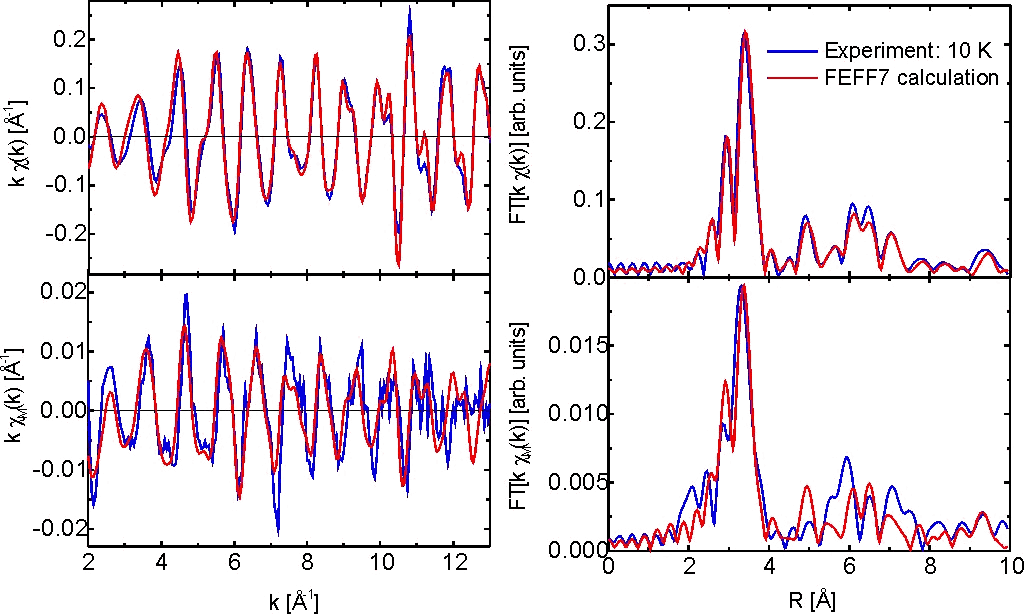
In Fig. 8 we plot together the experimental EXAFS (top) and MEXAFS (bottom)
for the Gd single crystal at T=10 K compared to ab initio calculations
using the FEFF7 code. The calculations show good agreement for the enveloping
amplitude and phase in k-space as well as in R-space for the splitting of
the main peak (RT resonance) and the peaks at larger distances. In Fig.
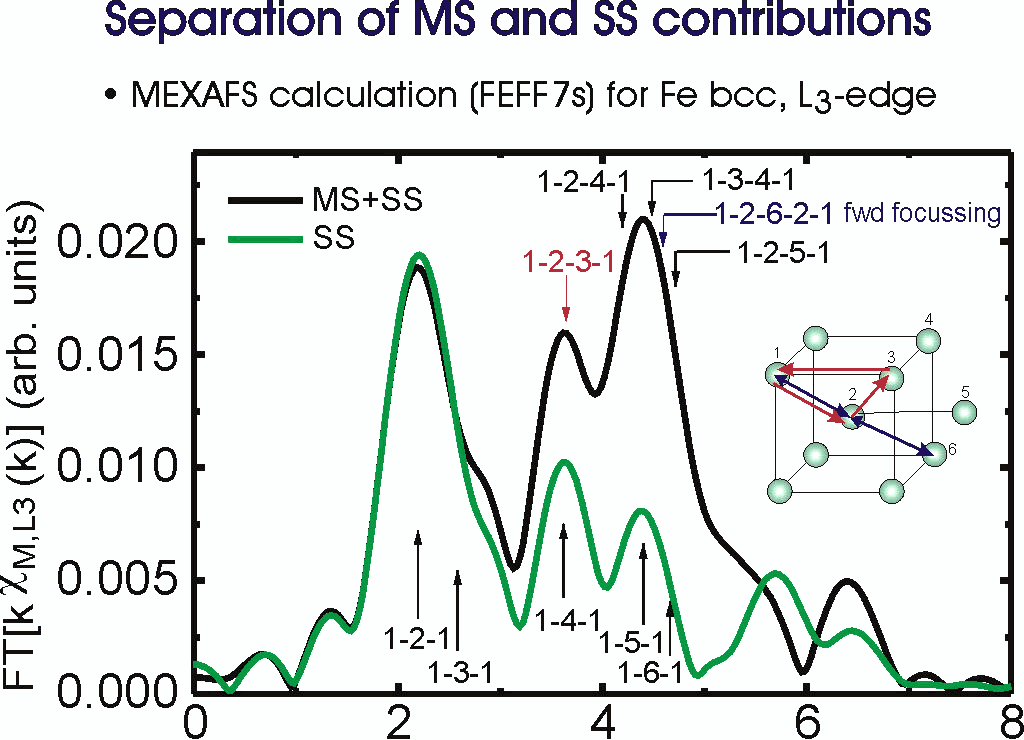
9 ab initio calculations of the MEXAFS for the bcc structure
(Fe) are plotted with the help of the FEFF7 code. The single scattering
contributions (dotted line) have been separated from the combined multiple
and single scattering contributions (solid line). The peaks are assigned
to the different scattering paths which are labeled according to the inset.
The separation of the paths allows for the unambiguous detection of strong
multiple scattering contributions for the MEXAFS which are not present
for the normal EXAFS (see also [Ref. 192] ).
Temperature-dependent measurements for both Fe and Gd [Refs. 214, 236, 246] have revealed a more
pronounced decay for the MEXAFS than the regular EXAFS and this effect
was attributed to contributions originating from the local spin disorder.
Fig. 8 |
Fig. 9 |