Sfb290
TP A2 UP I: Ferromagnetic Resonance (FMR)
(K.
Lenz, J. Lindner, E. Kosubek, K. Baberschke)
FMR is one of the best techniques to determine
the intrinsic magnetic anisotropy energy (MAE) quantitatively and
with high precision. The temperature, angular and frequency dependent
measurements in situ in UHV yield second- and fourth-order,
in-plane and out-of-plane MAE constants as a function of temperature.
All MAE constants are separated into interface and volume contributions
K i = Ki V
+2Ki S/d
by investigations at different film thickness d and at constant reduced
temperature t = T/TC(d). Simultaneously the anisotropy of the
orbital magnetic moment can be determined by the spectroscopic splitting
factor, i. e. the g-tensor from the simple relation µL/µS
= (g-2)/2 [Ref. 171, 210] . These experiments help
to understand how these quantities are modified in 3d and 4f films
and sandwiches relative to the bulk. Extrapolation of the measured
MAE constants to T=0K yields a direct comparison to first principles
MAE calculations. In addition the magnetization dynamics and spin fluctuations
on the nanosecond scale can be studied and the temperature dependence
of the total magnetization of monolayers can be determined. Some highlights
are given below.
- The anomalous spin reorientation transition in tetragonal Ni(001) films on Cu(001)
-
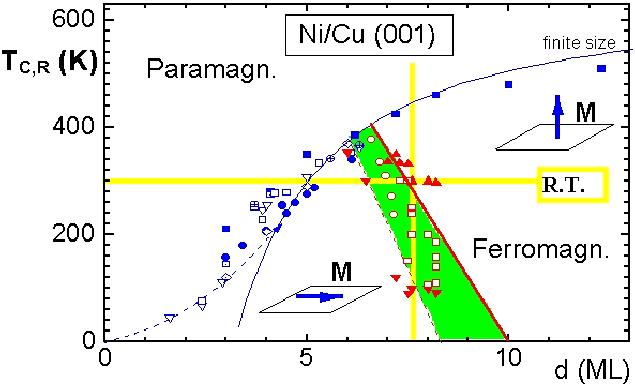
The magnetic phases in
Ni/Cu(001) are shown as a function of temperature and film thickness
d in Fig. 1 [Ref. 184] . The blue data
points indicate the thickness dependent Curie temperature separating
the paramagnetic and ferromagnetic phase. In the ferromagnetic
region one finds a (T,d) parameter space with the easy axis of the
spontaneous magnetization parallel and perpendicular to the film
plane as indicated.
- Magnetic anisotropy energy and spectroscopic g tensor in superlattices
Both regions are separated by the green shaded space in which an equilibrium tilted magnetization is measured. Using the yellow lines as a guide one observes an anomalous reorientation from in-plane to out-of-plane with increasing thickness or temperature . This is opposite to the conventional observation in Fe and Co layers. The magnetization rotates as a function of temperature (fixed d) as well as a function of thickness (fixed T) continuously, indicating a second order transition.
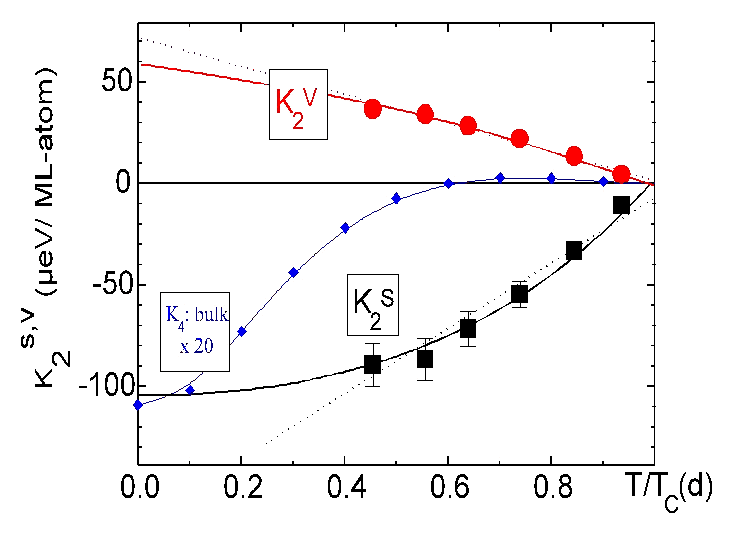
This unconventional reorientation is quantitatively understood by the
measured temperature dependencies of interface and volume MAE
[Ref. 180,185]
as shown in Fig. 2. K2V is positive favoring
a perpendicular orientation while K2 S is
negative favoring an in-plane magnetization. Both decrease as a function
of temperature. The different temperature dependencies and the thickness
dependent balance of shape anisotropy and intrinsic MAE explain the magnetic
phase diagram of Fig.1 quantitatively.
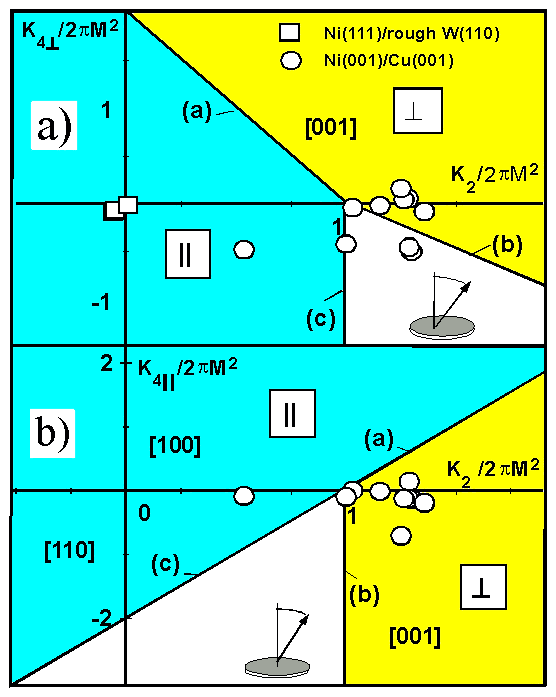
Fourth-order anisotropy constant must be included in the free energy
density E to explain the tilted orientation (green area) in Fig.1
. In Fig. 3 (on the left) we show the threedimensional parameter set
K 4|| = f(K2) and K4perp = f(K2).
All Ki are normalized to 2piM2 [Ref. 176, 184] .
The light blue (yellow) areas indicate an easy in-plane (perpendicular)
spontaneous magnetization. The white region presents the parameter
space for a tilted orientation. The MAE constants vary as a
function of film thickness and temperature. For different samples, temperatures
and thicknesses the experimental data are indicated. As an example
we show values for Ni/Cu(001) near the reorientation (green area in
Fig.1) and for Ni(111)/W(110) [Ref. 120, 171] . Ni/W has very
small K4 and K2 values (open squares), consequently
this film has its easy axis in-plane under all conditions. Contrary Ni/Cu
with large uniaxial K2 values and moderate (negative and positive)
K4 values permits all orientations as an easy axis. The physical
reason for this is the pseudomorphic growth and its tetragonal distortion,
whereas Ni/W grows in an undistorted cubic phase.
- In situ FMR on magnetic trilayers: Direct determination of interlayer coupling
Recently
we have employed FMR to measure the magnetic anisotropy constants
and the spectroscopic g tensor of high quality single-crystalline
Fe/V superlattices (SL) on MgO(001). The samples were provided from
the Group of R. Waeppling, Uppsala
University . FMR is the most suitable technique for determining
all magnetic anisotropy constants via angular-dependent measurements
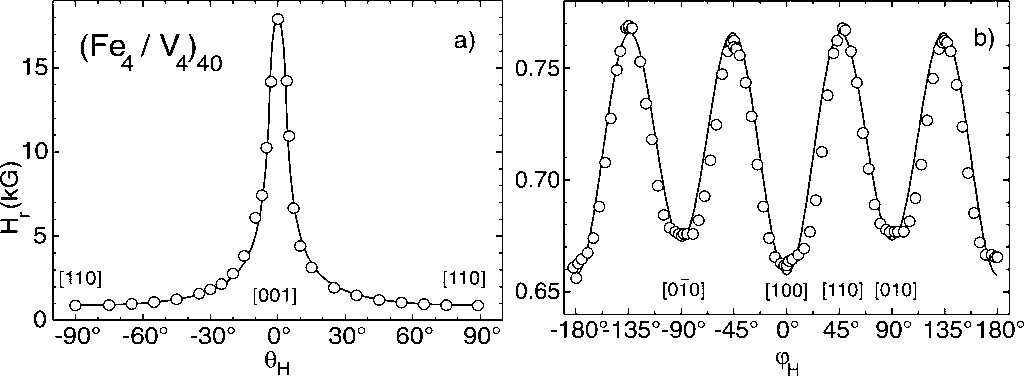
[e.g. Refs. 184,193,235]. In Fig. 4 we show full polar- and azimuthal-angular-dependent
FMR measurements of the resonance field Hr for an (Fe4/V4
)40 SL on MgO(001). The indices 4 are MLs of Fe or V
in one period, while 40 is the number of SL periods. From the positions
of the Hr -minima at qH=
±90o , Fig. 4(a), we conclude that the magnetization
lies in the film plane. In Fig. 4(b) we see a small in-plane anisotropy
with minima along the [100] and [010] directions. In addition a
smaller asymmetry between the two ideally identical [100] and [010]
directions indicates the presence of a small step-induced anisotropy
[Ref. 193] .
Frequency-dependent FMR measurements probe the components of the g
tensor and through this the orbital magnetism through the equation:
µL/µS = (g-2)/2
[Refs. 210, 234, 271] . FMR is
the only technique that may provide independently values for the
MAE and the anisotropy of the orbital moment (through measurements
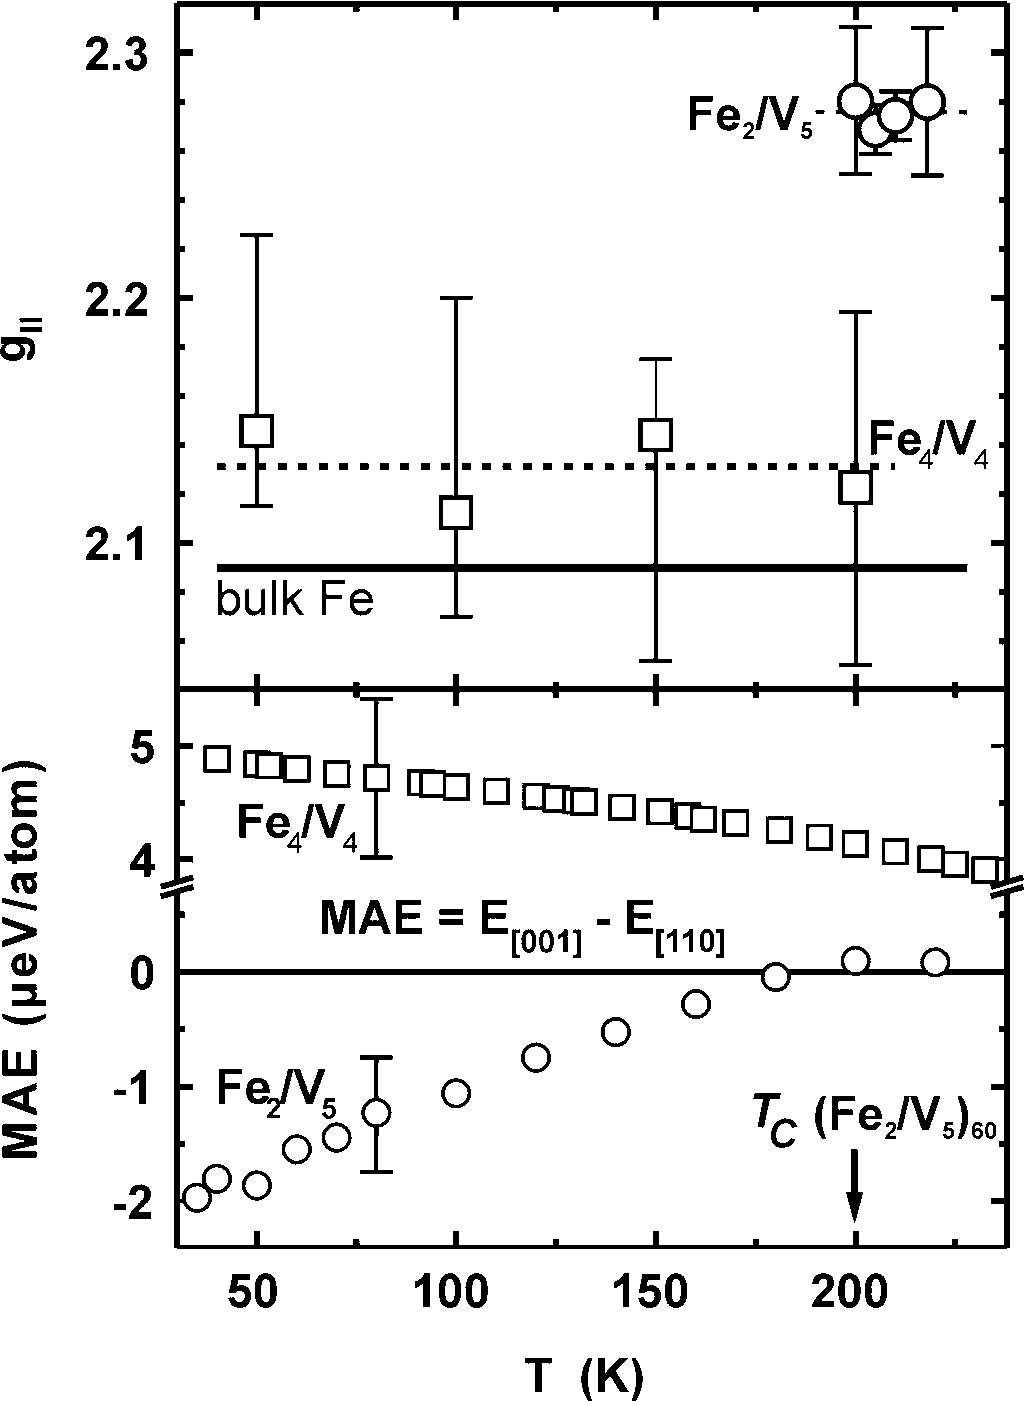
of the components of the g tensor). In Fig. 5(a) (on the left) we present
the components g// of the g tensor in the film plane for
two Fe/V superlattices. The values of g// are larger than
the values of bulk Fe. Since g is a function of the magnetic moment
it is temperature-independent. Note also that for the sample Fe2/V5
we probe g// at temperatures higher than TC as
the magnetic moment persists above TC. Unlike g//,
MAE is temperature-dependent. This is demonstrated in Fig. 5(b) for
both Fe/V samples. For the Fe 2/V5 sample we may
see that MAE vanishes at TC .
Another subject where FMR can give valuable information is the determination of interlayer exchange coupling Jinter in trilayers and multilayers. Recently we succeeded for the first time in a step-by-step in situ (in ultrahigh vacuum) investigation of Jinter via FMR in Ni/Cu/Co and Ni/Cu/Ni trilayers grown on Cu(001). In this process we first evaporate the one magnetic layer and the Cu spacer and measure the FMR signal (Fig. 6 bottom part, dotted lines). Then we evaporate the second magnetic layer. The FMR spectrum (Fig. 6 bottom part, solid lines) includes now two modes, the acoustic one where the two sublayer magnetizations precess in-phase, and the optic where they precess 180o out-of-phase. From the position of the optic with respect to the acoustic mode we conclude that the coupling is antiferromagnetic-AFM for the Ni/Cu/Co and ferromagnetic-FM for the Ni/Cu/Ni trilayer. For better illustration, on the top of Fig. 6 we introduce calculated FMR spectra for various values of Jinter for the two cases of AFM and FM coupling and schematic diagrams of the two modes. The calculations also suggest an independent measure for Jinter provided the trilayer can be investigated before and after the deposition of the topmost ferromagnetic film, since it can be seen that the signal of the bottom film shifts due to the coupling to higher (AFM coupling) or lower (FM coupling) field values. Thus, analyzing this shift also yields Jinter in absolute units. For more details see [Ref. 244,272,273] .
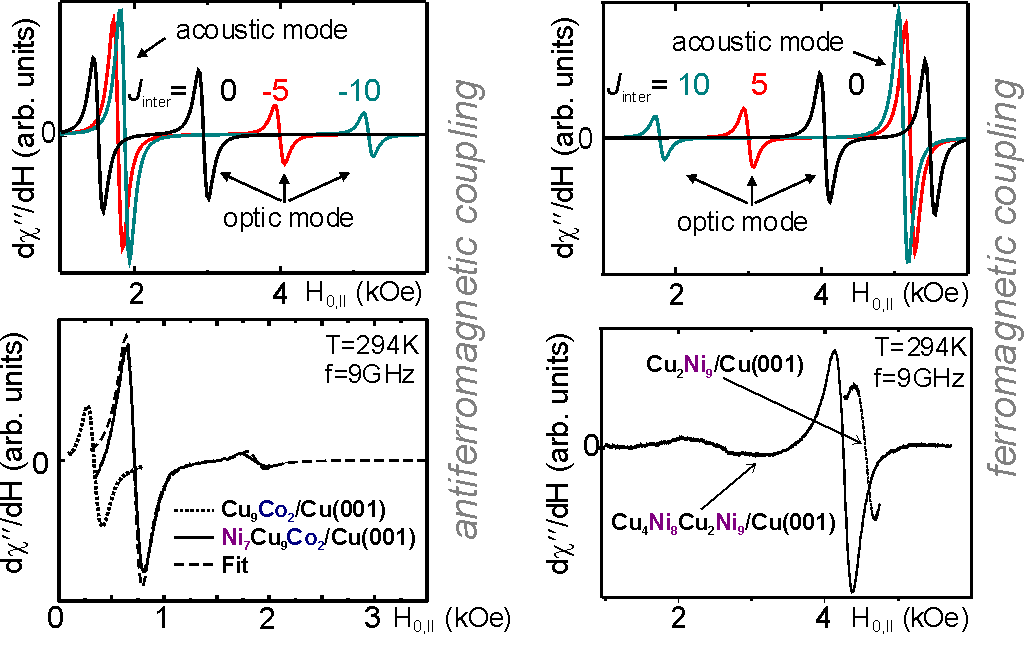 Fig.
6
Fig.
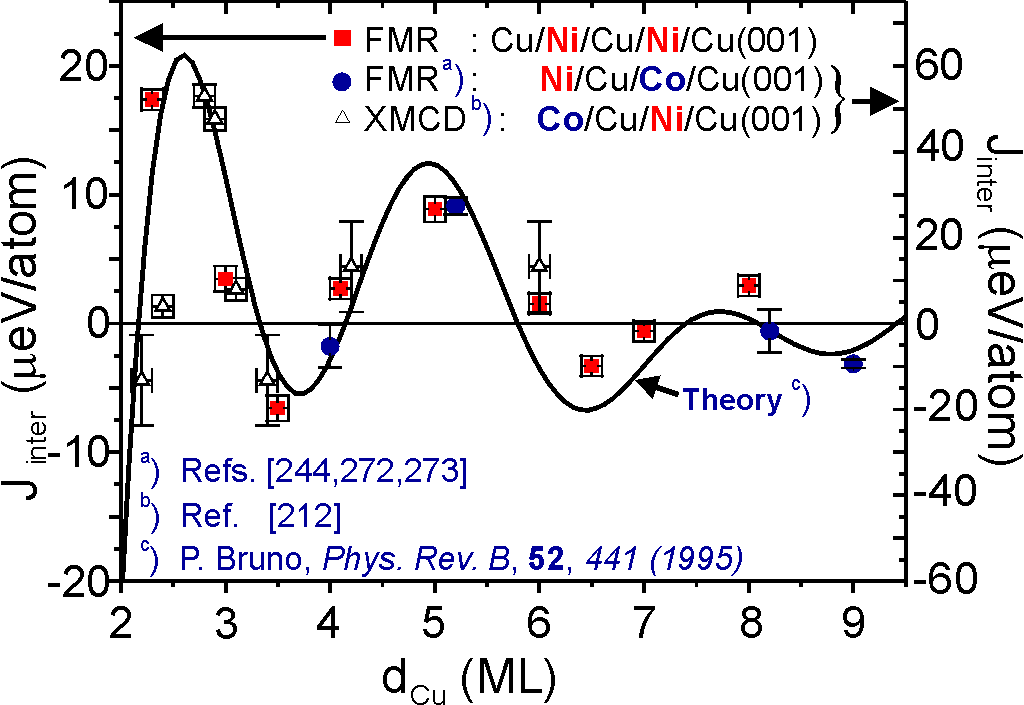
6In Fig. 7 the coupling Jinter is plotted as function of spacer thickness d. The right y-axis refers to Ni/Cu/Co- (blue circles) the left y-axis to Cu/Ni/Cu/Ni-trilayers (red squares, Ref.[244,272,273]) and XMCD data of Co/Cu/Ni-trilayers (open triangles, Ref. [212]). Since XMCD is does not provide absolute units, the values were scaled on the y-axis accordingly. One observes a clear oscillatory behavior for both systems which is in accordance to existing theories (solid line). The in situ approach in particular has advantages for very small spacer thicknesses, since the growth conditions can be well controlled (Note that in Fig. 7 the spacer thicknesses range between 2-10 ML only, i.e. the small period of the oscillatory coupling can be observed). The possibility of FMR to yield absolute values for Jinter (note that positive values reflect ferromagnetic, negative ones antiferromagnetic coupling) allows to plot the y-axis in energy per particle. This enables one to compare the results in a direct way to ab initio calculations as it was done in Ref.[281].
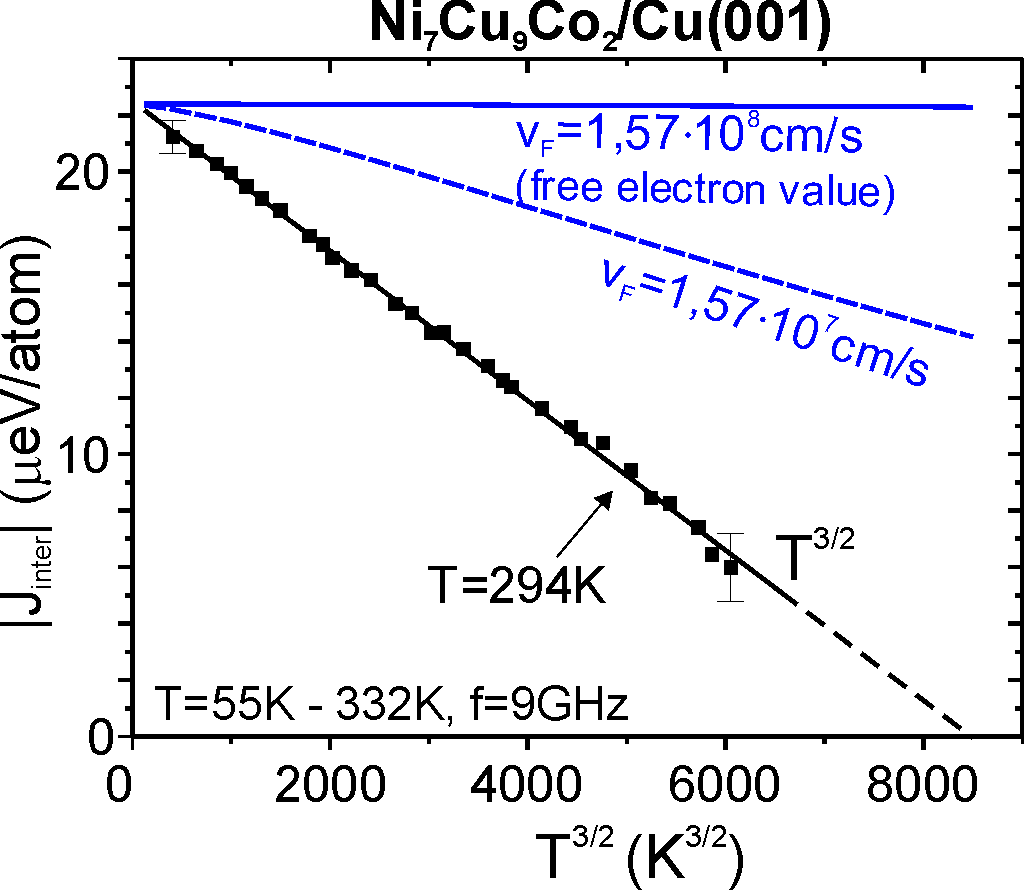
Another result is shown in Fig. 8 , where |Jinter| is analyzed as function of temperature T. Upon plotting the dependence as function of T 3/2 a power law behavior is found within a wide temperature range. This confirms theoretical predictions that the temperature dependence of Jinter is governed by thermal spin waves created in the ferromagnetic layers (Ref. [267]). Models which take band structure effects in the spacer material as source of the reduction of the coupling (blue lines shown for different Fermi velocities of the spacer electrons) play a minor role (e. g. P. Bruno, Phys. Rev. B, 52, 441 (1995)).
|
|
- Magnetic Damping / Spin Dynamics
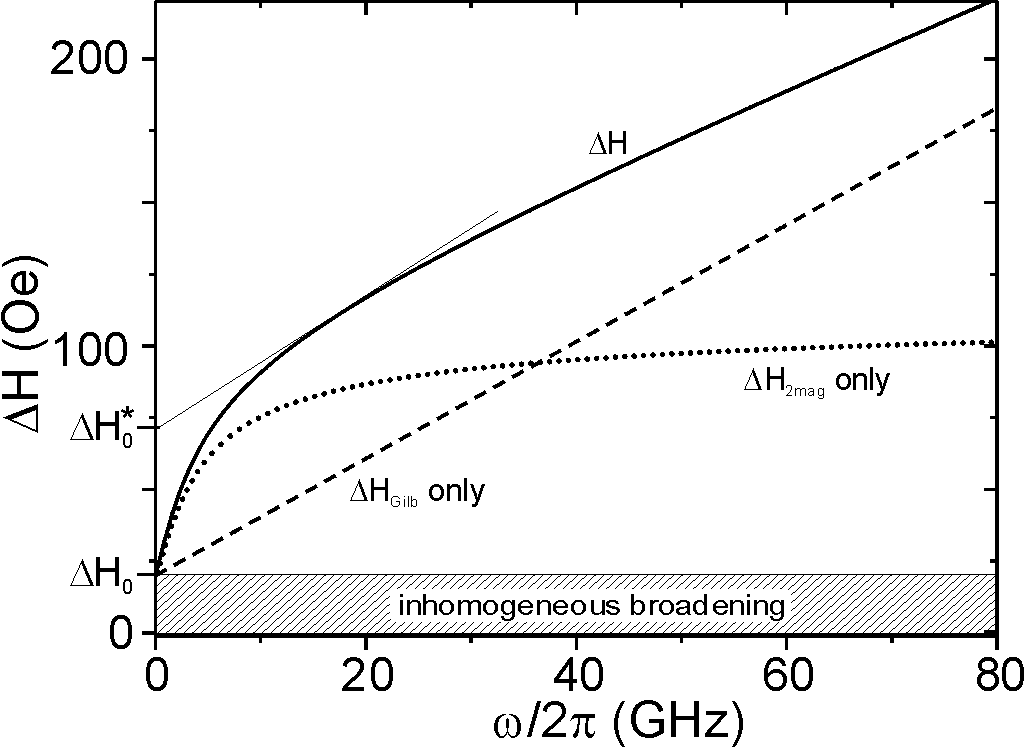
To control magnetization dynamics it is important to understand the microscopic damping of the magnetization vector. The magnetization dynamics can be studied by analysing the FMR linewidth which is directly related to the relaxation of the magnetization of the system. The most widely found inclusion of damping of the spin motion used in literature is the Gilbert approach given by the phenomenological expression
 .
.
-
This term can be seen as a ‘viscosity
type’ of damping for which the energy stored in the precessing magnetization
leaks into the thermal bath. For excitations being proportional to eift the Gilbert
expression leads necessarily to a linear increase of the damping with
the excitation frequency f as indicated schematically by the dashed curve in
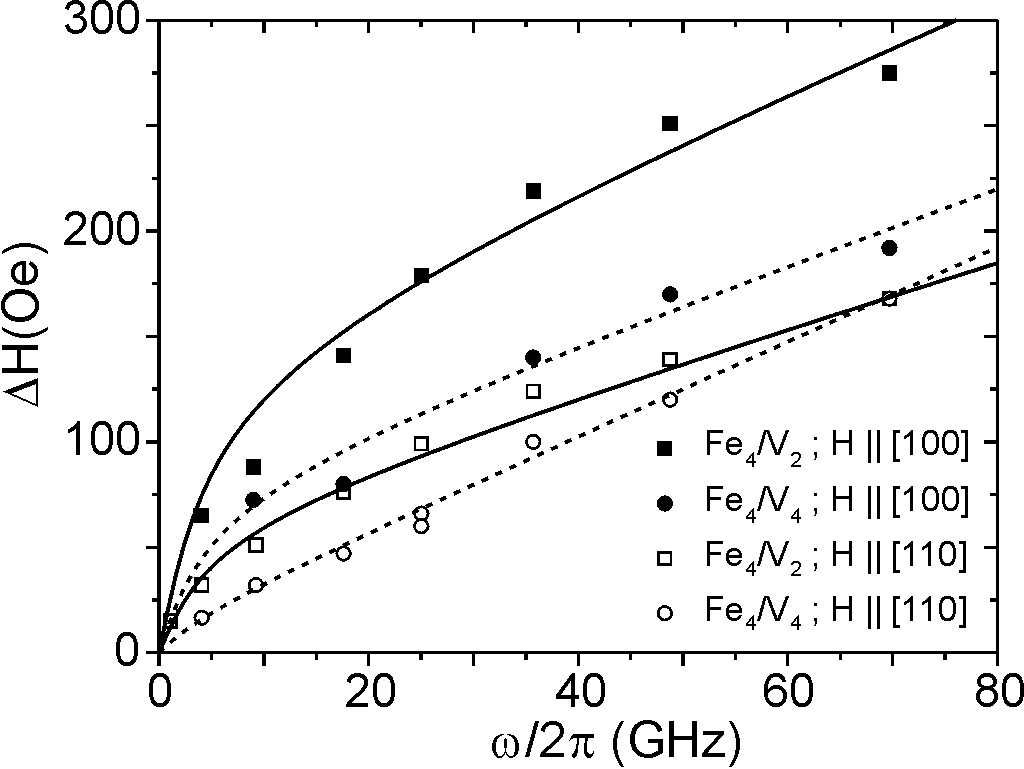
Fig. 9. As shown for the case of Fe/V multilayers in Fig. 10 FMR can
be used to test this linear dependence. The measurements performed within
a very large frequency window of 1-70 GHz show a clear curvature, in particular
for low frequencies. This deviation from the pure Gilbert-like behavior
can be understood upon taking the so-called two-magnon scattering as
another relaxation mechanism into account. In this process the uniform
mode with wavevector k=0 which is excited couples to degenerate
modes having wavevectors k>0.
The theoretical dependence on the excitation frequency is plotted as dotted
curve in Fig. 9. Taking into account a sum of a Gilbert-like contribution
and a two-magnon term (solid line in Fig. 9) one is able to fit the experimental
data (solid lines in Fig. 10). This shows the importance of non-Gilbert-like
contributions to the overall linewidth. Moreover, one observes different
curvatures for different orientations of the external field within the
film plane (see Fig. 10). This effect can be directly related to the dispersion
relation of the spin waves, since the possible final states with k>0 strongly depend on this dispersion which in turn
depends on the external field direction.
|
Fig. 9
|
Fig. 10
|
(last update: 21.08.2003)
